Clara - Dashboard
Year
2021
Role
Senior Product Designer (Transactions, Dashboard & Users)
Industry
Fintech
Main Tools
Figma · Log Rocket · Storybook · Userflow · GA4
Goal
he dashboard was the first page where the users landed when logged in into the platform and the engagement was low.

Users avoided the dashboard because key spending data is hidden, KPIs are unclear, and no action prompts exist, driving low adoption.

Discovery highlights
-
Focus group (internal) : Surfaced 8 recurring borrower pain-points and wish-list items.
-
FullStory replays (20 hrs) : 0–3 clicks per session on the dashboard; users bounced straight to “Transactions.”
-
End-user interviews (n = 10) : All ranked spending behaviour, next actions, and credit insights as top needs.
-
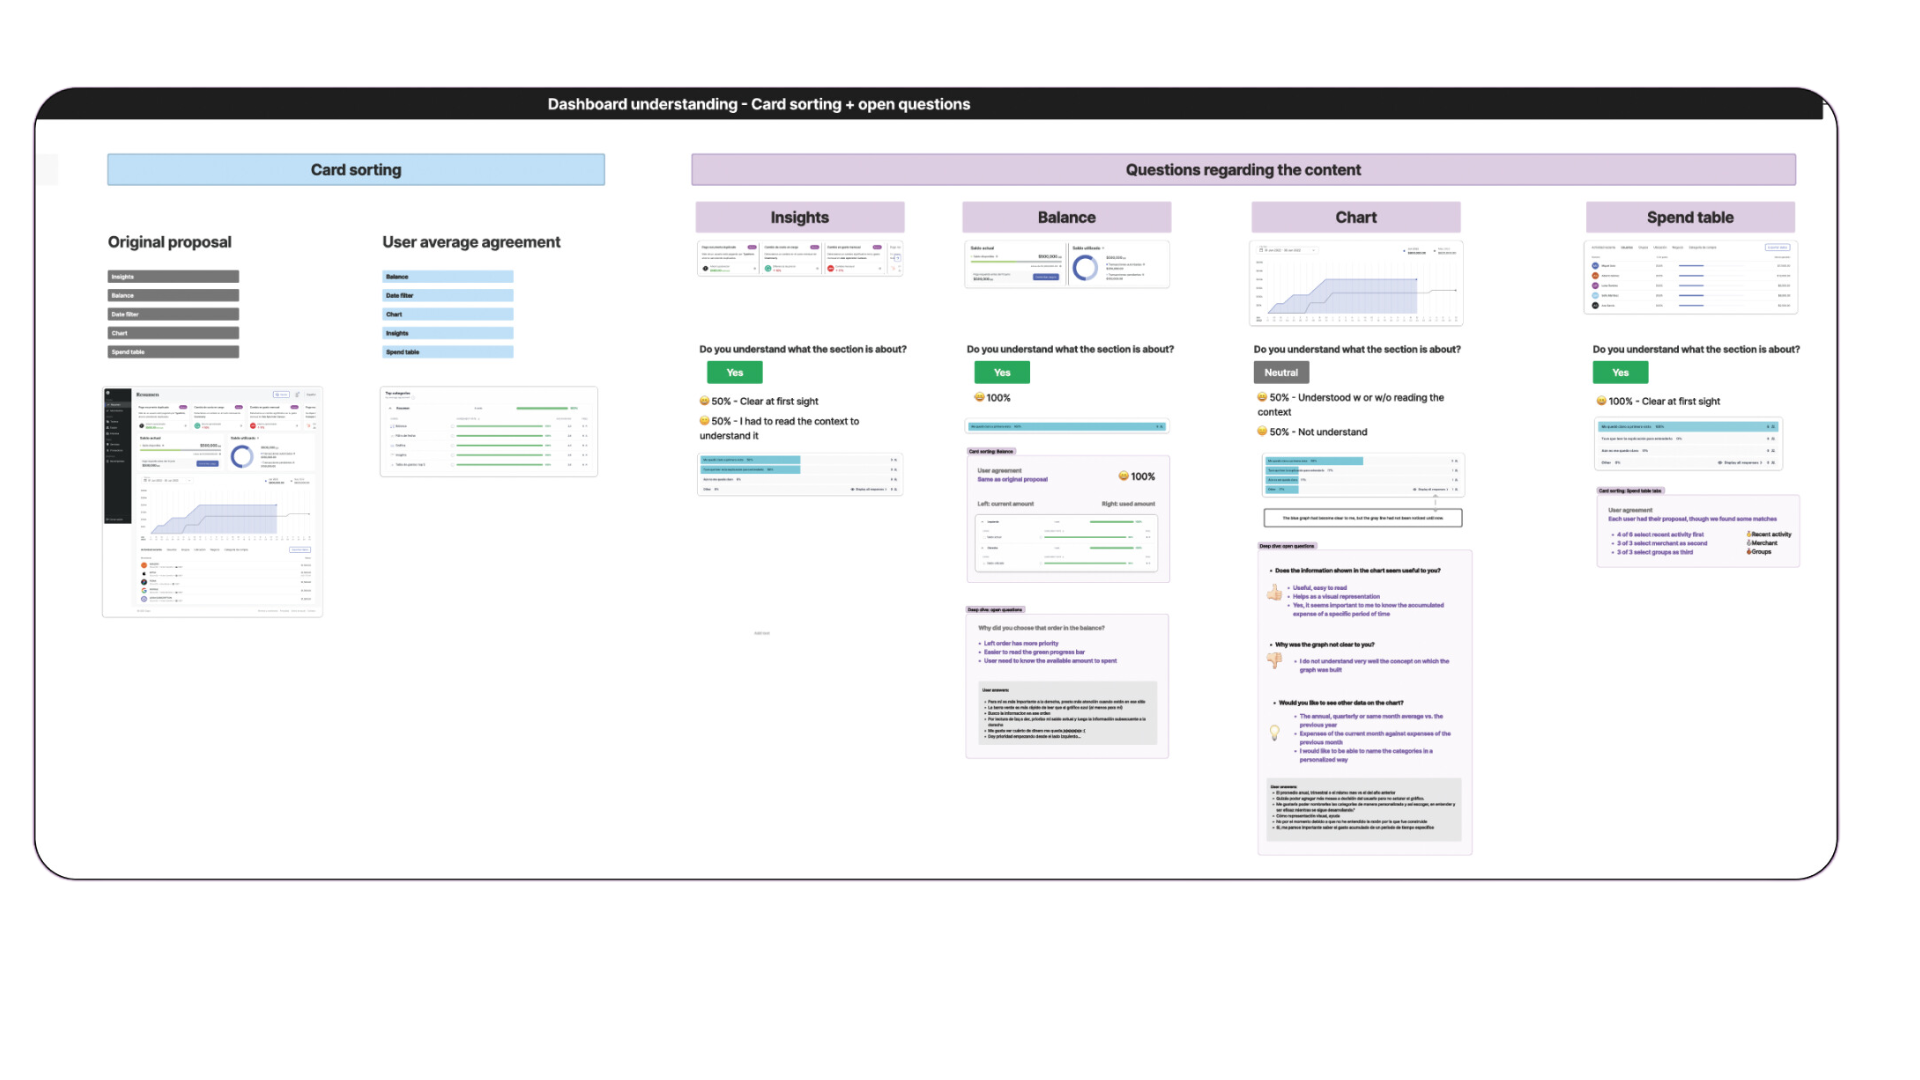
Ranking exercise: Participants ordered 15 cards; 90 % placed “Upcoming payments” and “Savings tips” in the top 5.


Delivery
-
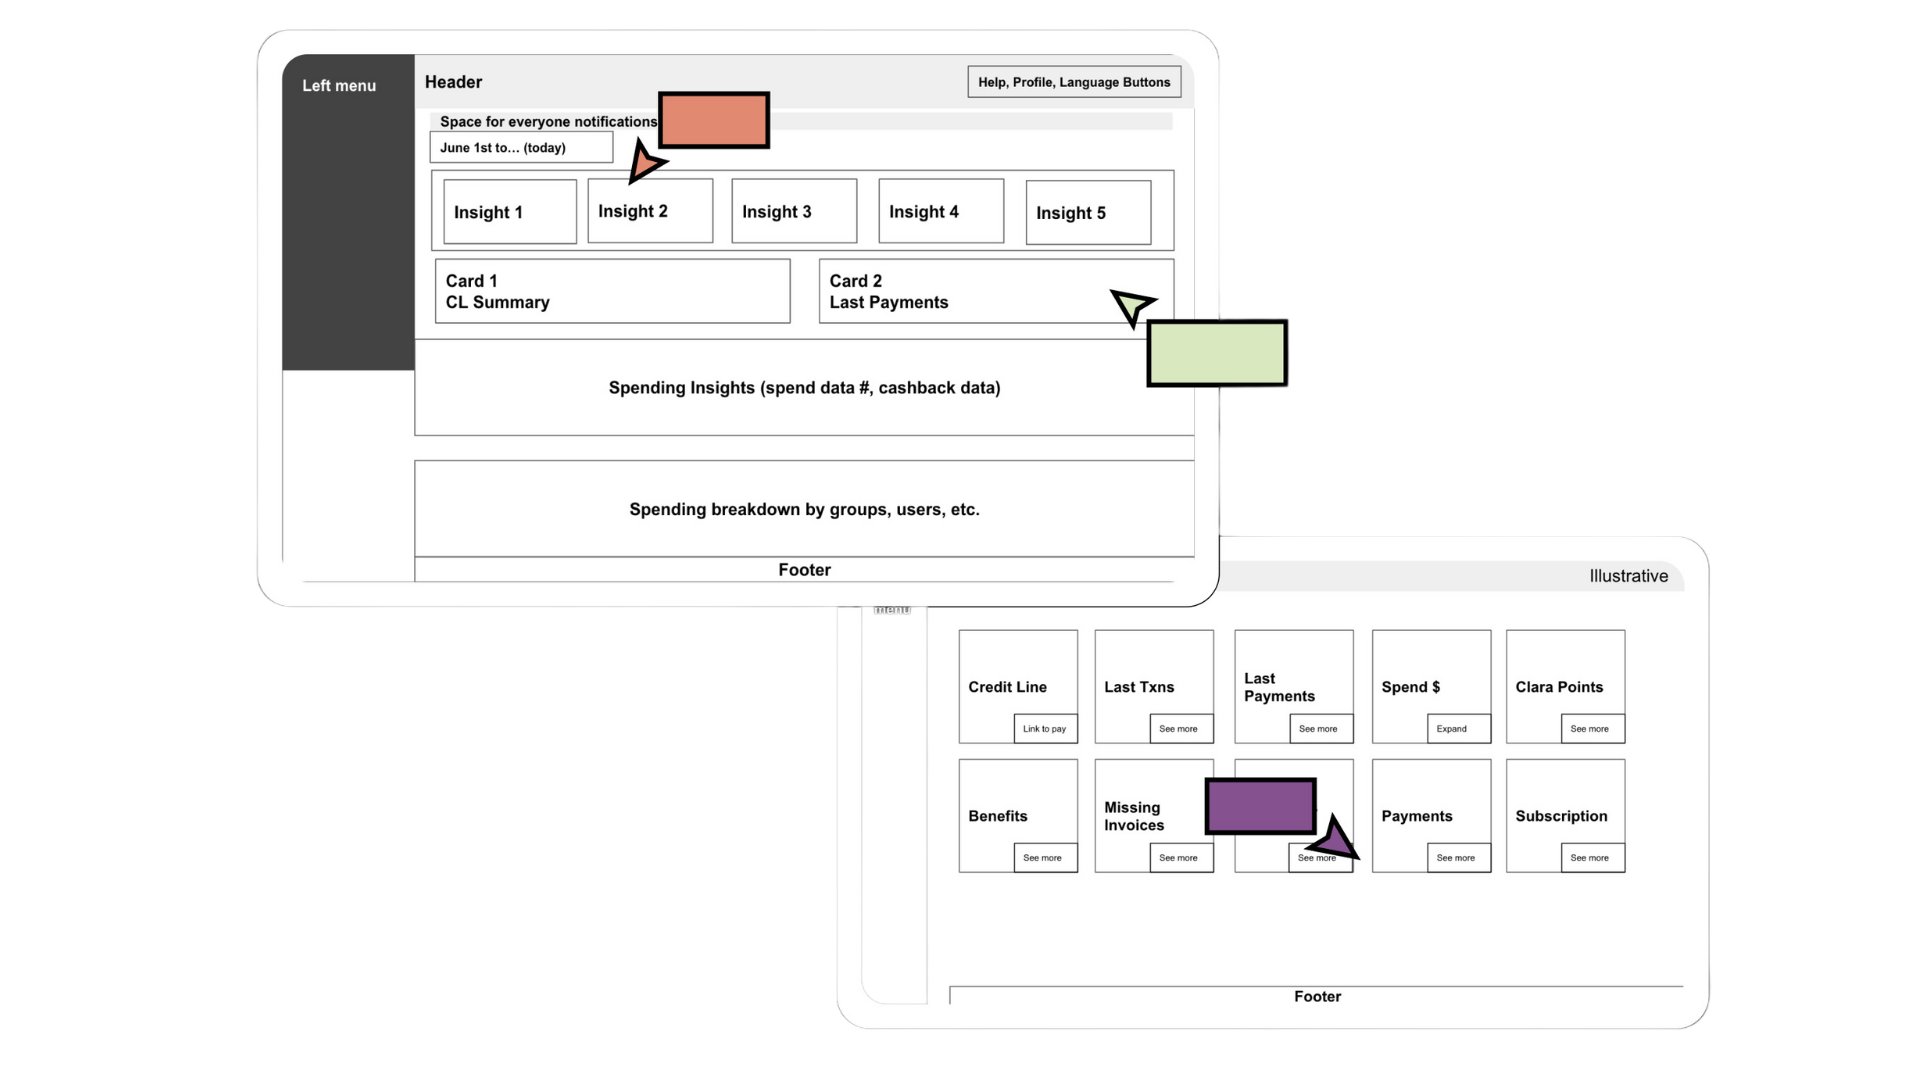
Low-fi sketch workshop with Product, Eng, Data → aligned on feasible data feeds.
-
Card-based layout: four summary tiles (credit used, available, upcoming payment, insights).
-
Action prompts: “Raise limit,” “Schedule payment,” “Download statement.”
-
Insight engine v1: Data science auto-generates spend-pattern tips.
-
Componentised in Design System (tokens, ≤4 pt grid) for future reuse.

A follow-up research session was recommended 3 months post-launch.
